

By Robin Browne | December 26, 2017
For any given site, you would typically have many content groups. For example, you are a car manufacturer, and your site has car models that covers a range in the market. How would you see the overlap in interest between your different car models?
Adobe Analytics’ workspace feature allows you to create segment overlap report to see how the users are converging. But unfortunately, you can only do 3 segments, and cannot easily generate n combinations of segments.
Problem Statement
- For a site with n products
- Show the most popular combination of top y products viewed within a visit
- And by combination I don’t mean within the same page, what I am looking for is within the same visit in any order
A quick way to do this is to use the segment overlap feature Adobe Analytics. But you can only do 2 segments at a time. I wanted something that scales up much better and can do things like find the overlap for the top 10, 20, n products. And should be easily adaptable across projects.
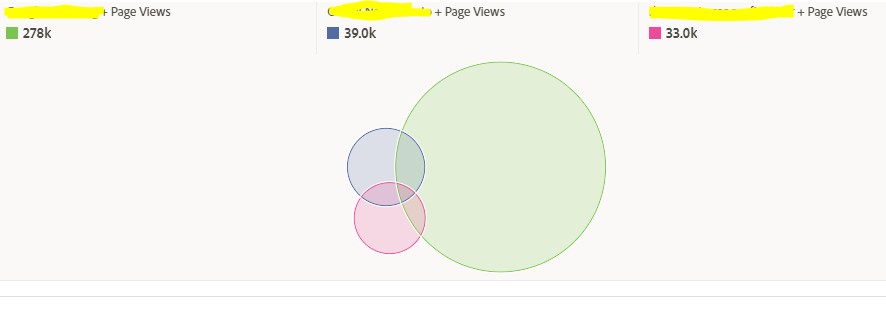
What it looks like, but is not
Also as far as I am aware, this is different from Product Affinity because that is done at a transaction level, and all the products are contained within the same call from the Thank You page. What I was looking for was product viewed separately somewhere within the same visit [or even visitor level if need be].
Result
Let me showcase the results of the scripts that I have built first:
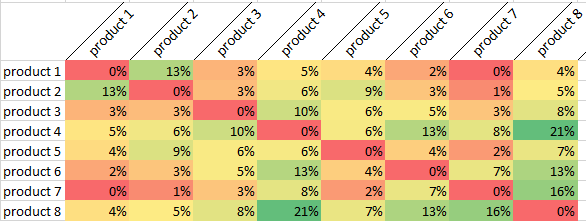
- The above contains a simulated result based on real test runs
- The overlap percentage shows the percentage of visits in which both products were seen
- As you can see the product8 model shows the highest overlap with other models
- It’s an SUV with an accessible price range
- It’s associated models seem to be sedans and cross over vehicles below its price range
- So one observation could be that, this is a prime target for upselling
How to Use it for your Projects
- The solution is created in R
- The script and a guide are contained at this Github link
I have put it up as a Github project, so that you can easily pull it using RStudio. A handy guide is to be found here.
Do note: Since it’s creating overlapping segments it takes a while to run. For instance, for 10 products it needs to make 44 API calls, for 20 products 188 API calls and so on. So if you increase the number of products, the number of requests scales exponentially.
The Code
First we load the libraries
  # load library ----
    library(tidyverse)
    library(RSiteCatalyst)
    library(jsonlite)
Authenticate with Adobe Analytics
The following function from RSiteCatalyst allows yout to authenticate against your Adobe account credentials.
SCAuth("your api user id","your api passphrase")If you have admin access to Adobe Analytics, it’ll be available in your user profile page. Otherwise, ask your account admin to add you to the Web Services API group.
Define Metadata
This is a simple showcase, and as such only 2 things are defined here:
  # define metadata ----
  date_range  <- list(
    "start" = "2017-12-03",
    "end" = "2017-12-09"
  )
  TRUE

  # define the report suite to pull data from
  rsid <- "xxxxxxx-xx-x"
Defining the segment ingredients
The whole idea is to dynamically generate segments. In that case, what are your ingredients? In this particular case, we have our model names stored in an eVar. So we need the top models for the time range defined. We simply make a QueueRanked report which tells us the top n models which we can use to generate the overlapping segment conditions.
# get ingredients for segment ----
  # get car model name in this instance
  product_id <- QueueRanked(
    reportsuite.id = rsid,
    date.from = date_range$start,
    date.to = date_range$end,
    metrics = "visits",
    elements = "evarX",
    top = 10
  )
Segment Overlap API request
Now that we know our top models, we want to create segments for the top combinations. We’re creating a series of segments with Model A + Model B in them. We loop through the model combinations, be careful, the number of combinations increases exponentially so it would take a lot of time to execute if you have a large set of inputs.
# calculate overlap in visits for each model combination
  for (i in 1:(nrow(product_id)-1)) {
    for (j in (i + 1) : nrow(product_id)) {
      product_segment <- c(product_id$name[i],product_id$name[j])
      # create segment
      mySegment<- list(container=list(type=unbox("visits"),
                                      rules = data.frame(
                                        name = "models",
                                        element = "evar7",
                                        operator = "contains",
                                        value = product_segment
                                      )))

      df2 <- QueueOvertime(
        reportsuite.id =  rsid,
        date.from = date_range$start,
        date.to = date_range$end,
        metrics = "visits",
        date.granularity = "week",
        segment.inline =  mySegment)

      df3 <- df2 %>% select(visits) %>%
        mutate(
          model1 = product_id$name[i],
          model2 = product_id$name[j]
        ) %>% select(model1,model2,visits)

      if(i == 1 & j == 2){
        car_segment_data <- df3
      }else{
        car_segment_data <- rbind(car_segment_data,df3)
      }

    }
    paste0(i,j)
  }
Results
I have shown the resulting image on top of the blog.
How you can help
Just by itself, the report only showcases some correlation. It doesn’t give you supporting evidence for why such a correlation exists. If we can automate report pull from other elements it might make the report more meaningful. And since it’s on Github, you can submit pull requests to enhance the script.
Current To Dos
- The final percentage calculation is currently done manually, automate that in next build
- Visualise the results better within R
- Make it more plug and play for different projects