

By Robin Browne | December 29, 2017
I recently came across a tweet by Mara Averick where she talked about patchwork, a library to help you arrange your ggplot outputs.
Some fresh viz ✨ magic from @thomasp85
— Mara Averick (@dataandme) December 6, 2017
"patchwork: the composer of ggplots" https://t.co/FtSNVDmV42 #rstats #ggplot2 #dataviz pic.twitter.com/wjb4xJcF2W
A Basic Example
From Thomas’ Github page:
Load Library
  library(ggplot2)
  library(patchwork)
  library(dplyr)
Output
  p1 <- ggplot(mtcars) + geom_point(aes(mpg, disp))
  p2 <- ggplot(mtcars) + geom_boxplot(aes(gear, disp, group = gear))

  p1 + p2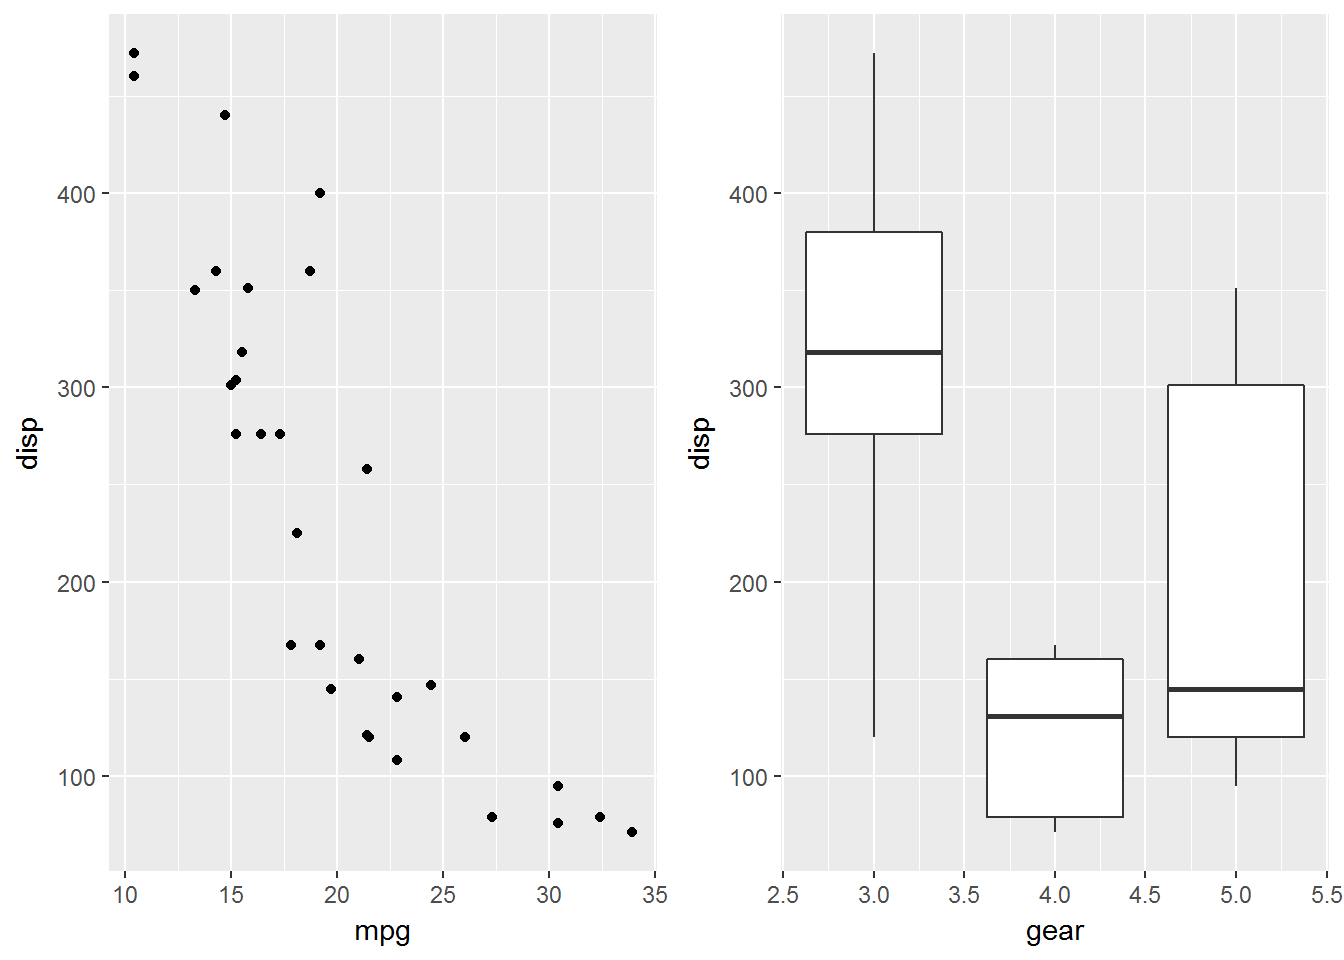
comments powered by Disqus